
TrendSpider has quickly become one of the best trading software for Mac users, and for good reason.
While many charting tools leave you doing the heavy lifting, TrendSpider takes a different approach: it automates the tedious, error-prone parts of technical analysis so you can focus on execution and strategy.
We still think TradingView is the best all-round charting platform, but when it comes to automation and smart technical scanning, TrendSpider is one of the best automated tools we’ve tested for stocks, forex, crypto, and futures.
In this updated 2025 review, we’ll walk you through TrendSpider’s pricing, features, and why it could transform the way you trade.
TrendSpider Pricing
Firstly, let’s get down to business with the pricing. There are four main TrendSpider subscription plans – each offering the full feature set, with tiered capacities and support levels.
- Standard Plan ($39/month)
- 5 workspaces
- 5 trading bots
- 10 alerts (expire in 30 days)
- Backtesting: 2-hour range (2K depth)
- Scanning: 2-hour range
- Standard support + 1 training session/year
- Premium Plan ($79/month)
- 10 workspaces
- 10 trading bots
- 50 alerts (90 days)
- Backtesting: up to 10K depth at 5-minute granularity
- Scanning: 5-minute granularity
- Standard support + 2 training sessions/year
- Enhanced Plan ($129/month)
- 15 workspaces
- 50 trading bots
- 100 alerts (180 days)
- Backtesting: 20K depth at 1-minute granularity
- Scanning: 1-minute granularity
- Priority support + 3 training sessions/year
- Advanced Plan ($229/month)
- 20 workspaces
- 100 trading bots
- 400 alerts (365 days)
- Backtesting: 30K depth at 1-minute granularity
- Scanning: 1-minute granularity
- Priority support + up to 52 training sessions/year (one per week)
Additional Fees & Add-Ons
- Real-time futures data: $7.50/month (Non-Pro users) or $90/year
- Professional trader data fee (for U.S. equities): Additional $29/month or $348/year
- 10 free Sidekick messages per calendar month with extended limits starting at $49/month
There’s no doubt that TrendSpider is one of the more expensive technical analysis tools out there especially when compared to our favorite trading software, TradingView.
In comparison to this, TradingView pricing as follows:
- Basic: Free (limited tools & data)
- Essential: $14.95/month
- Plus: $29.95/month
- Premium: $59.95/month
- Ultimate: $99.95/month
- Annual billing saves ~16%
TradingView is clearly cheaper at entry level and better if you just need charts and community tools.
TrendSpider is more expensive, but includes automation (trendlines, heatmaps, multi-timeframe scans) and now AI (Sidekick) which are all features TradingView doesn’t currently match.
I’d say that for traders who want raw charting, TradingView is better value. For traders who prioritize automation + AI insights, TrendSpider is worth the higher price.
TrendSpider Main Features
TrendSpider offers a wealth of ways to analyze stocks but my favorite tools are the following.
Customizable Charts
TrendSpider’s charts are clean, fast, and packed with tools:
- Over 95+ technical indicators ready to apply.
- Custom watchlists, scanners, and notes in the side panel.
- Display up to four charts at once for multi-perspective analysis.
- Toggle indicators on/off to avoid chart clutter.
- Light and dark themes for comfortable viewing.
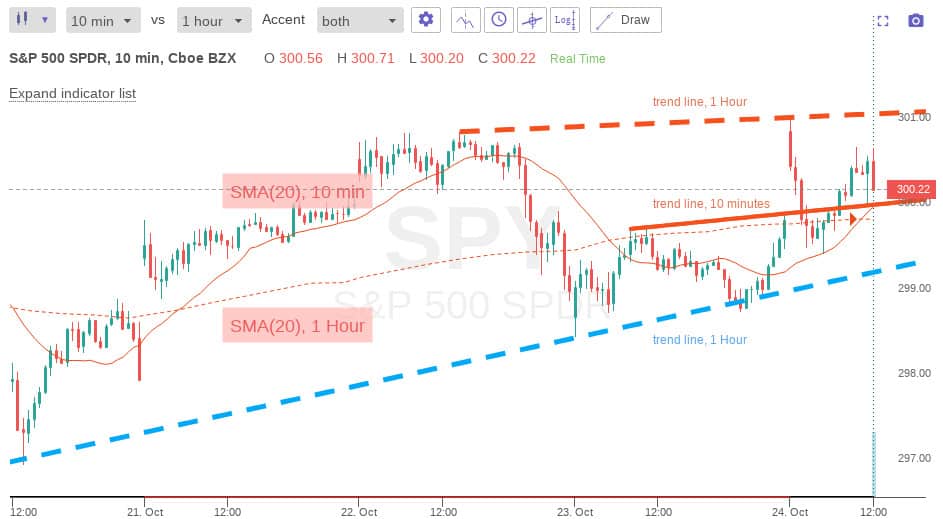
Automated Trendline Detection
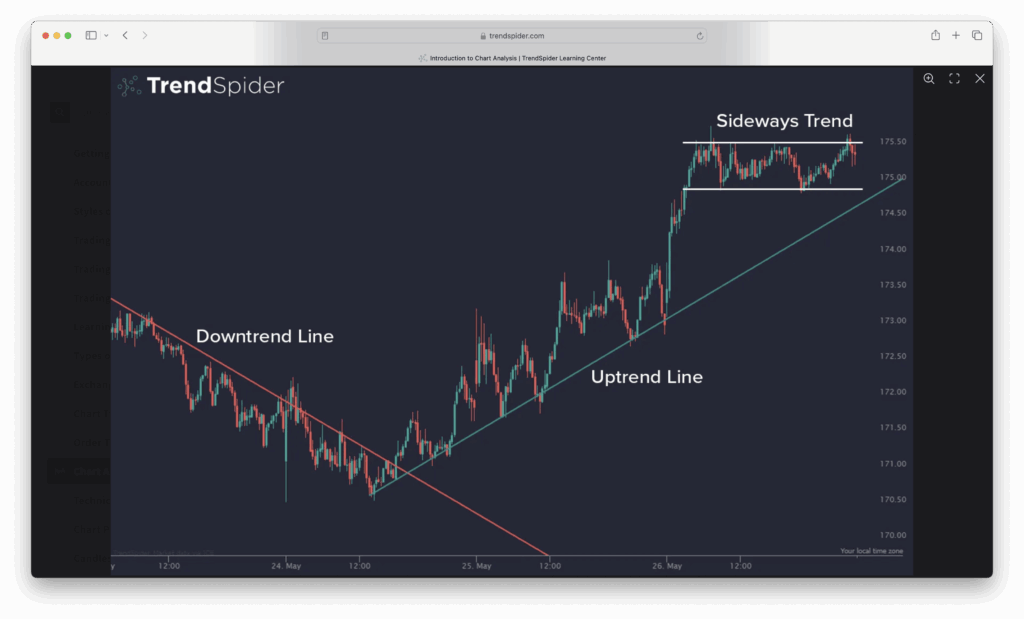
Drawing trendlines manually is time-consuming and often subjective. TrendSpider’s algorithms do it for you, instantly highlighting tightening price action and potential breakout zones.
- Toggle “Show Trends” on/off at will.
- Automated candlestick recognition (Doji, Hammer, etc.).
- Save hours of manual chart work.
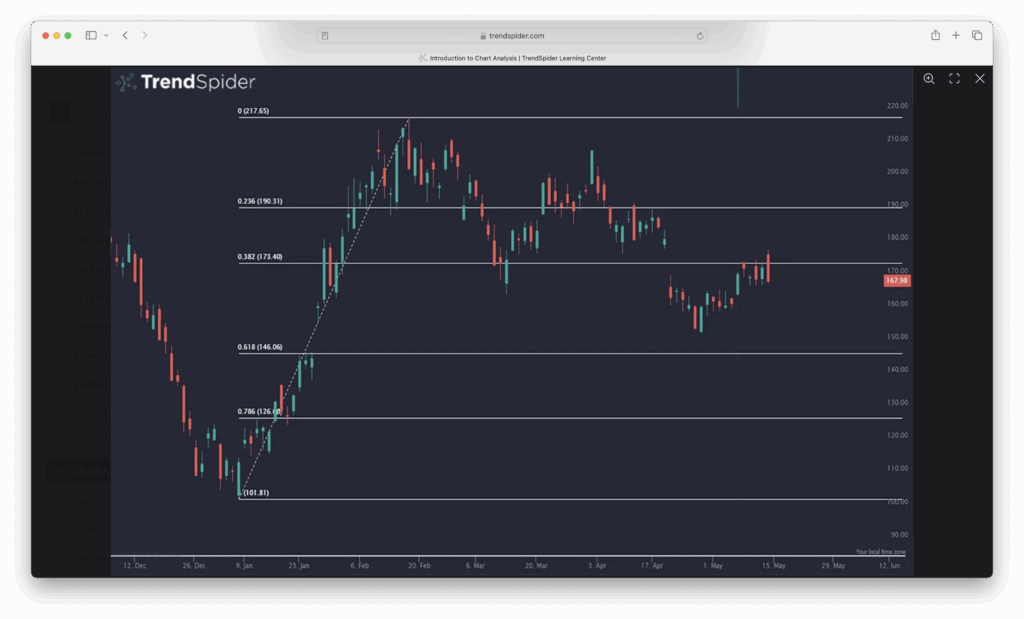
Smart Heatmaps & Fibonacci Levels
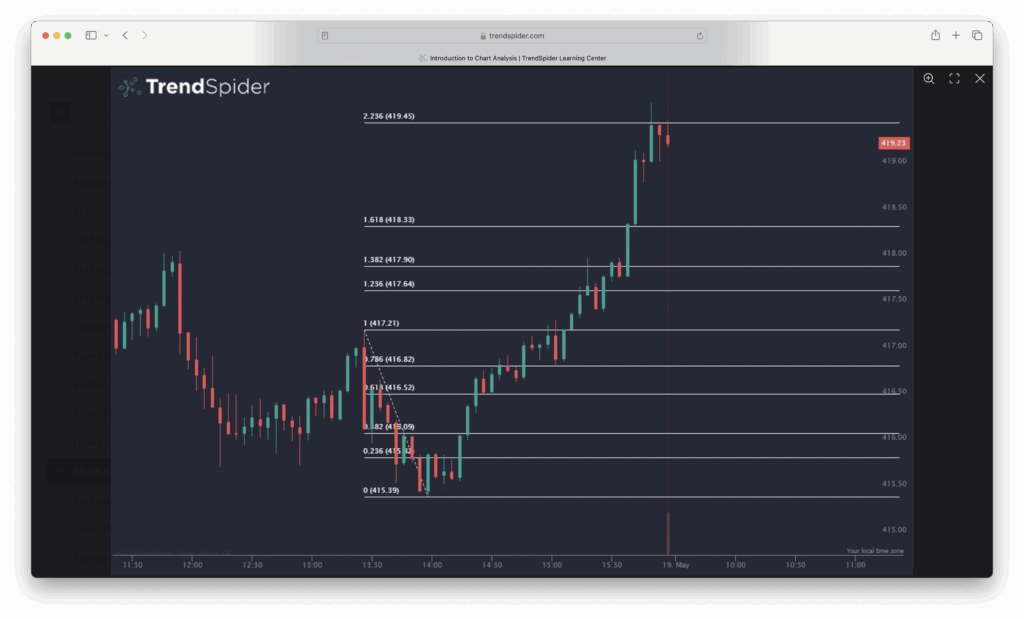
Support and resistance are crucial, but spotting them consistently isn’t easy.
TrendSpider automatically generates heatmaps and Fibonacci retracements, so you instantly see where markets are likely to react.
This is particularly powerful for forex, futures, and crypto traders.
Multi-Timeframe Analysis
Instead of flipping between charts, you can overlay two or more timeframes on one chart.
For example, combine the daily and weekly view to confirm signals with higher-level trends.
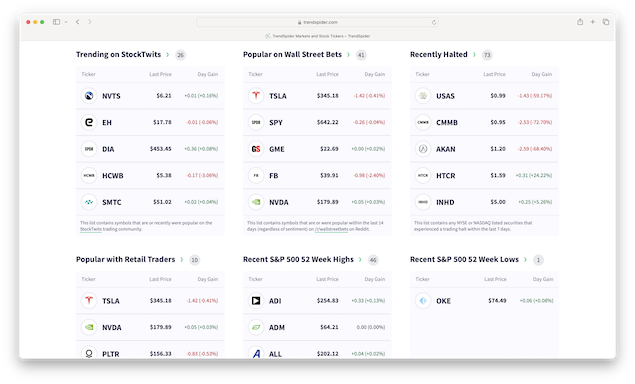
Market Scanner
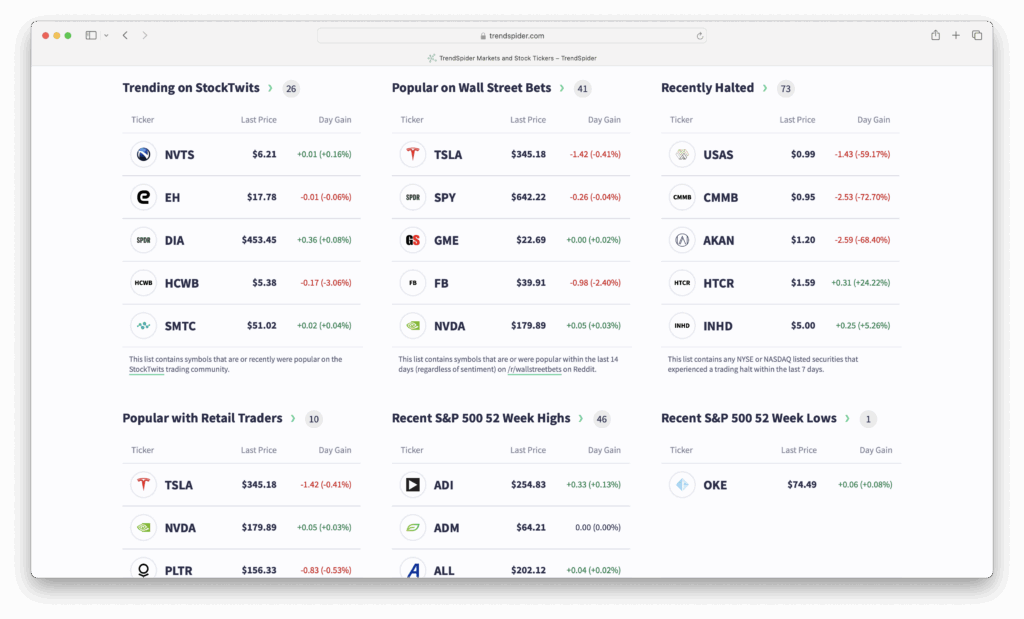
TrendSpider’s Market Scanner can analyze multiple timeframes and conditions simultaneously, making it one of the fastest ways to screen for trading opportunities.
- Detect candlestick patterns, volume surges, or technical indicators.
- Scan across entire watchlists or markets in seconds.
- Highlight popular stocks on StockTwits, Retail Traders, Wall Street Bets and more
Dynamic Alerts
Any decent stock charting tool includes a way of triggering alerts when certain market or price conditions are met and TendSpider has an extremely effective alert system.
TrendSpider Alerts allow you exit a trade at the optimum price point and you can set Dynamic Alert triggers such as trendlines and indicators or multi factor alerts.
Alerts are where TrendSpider shines:
- Create multi-condition alerts (e.g. MACD cross + price breakout).
- Add sensitivity ranges, so you’re not triggered by tiny price moves.
- Set alerts for breakouts, bounces, or trendline touches.
- Alerts trigger instantly via mobile or desktop.
These alerts reduce the risk of missed opportunities and help you trade more confidently.
Strategy Tester (Backtesting)
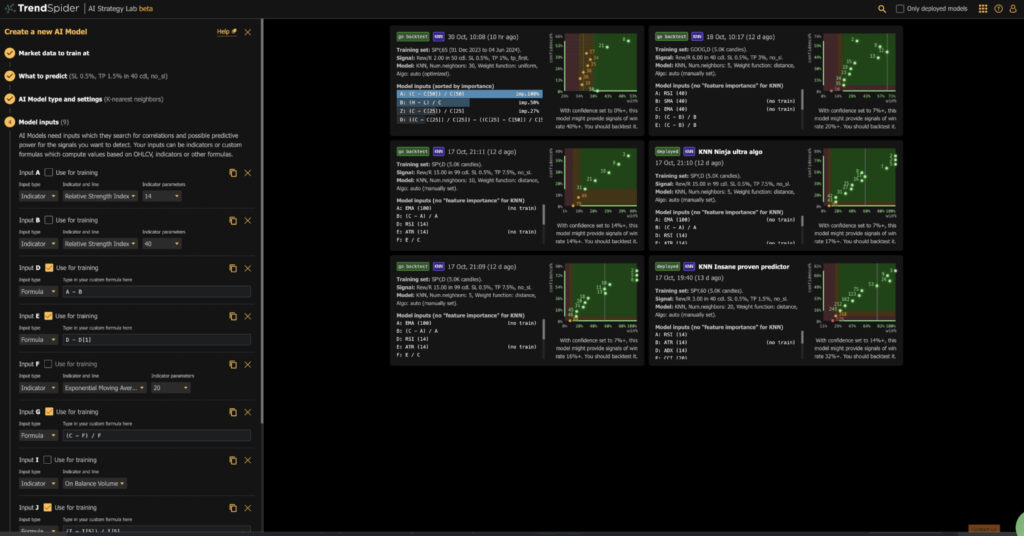
TrendSpider’s built-in Strategy Tester lets you backtest any strategy against years of historical data.
- Test indicators, candlestick patterns, or custom strategies.
- See win rates, profit factors, and equity curves.
- Currently limited to one instrument at a time, but extremely useful for refining your approach.
You can only backtest on one instrument at a time but it’s an extremely interesting and revealing way of testing your trading strategies without risking any capital.
What’s New in 2025: The Sidekick AI Trading Assistant
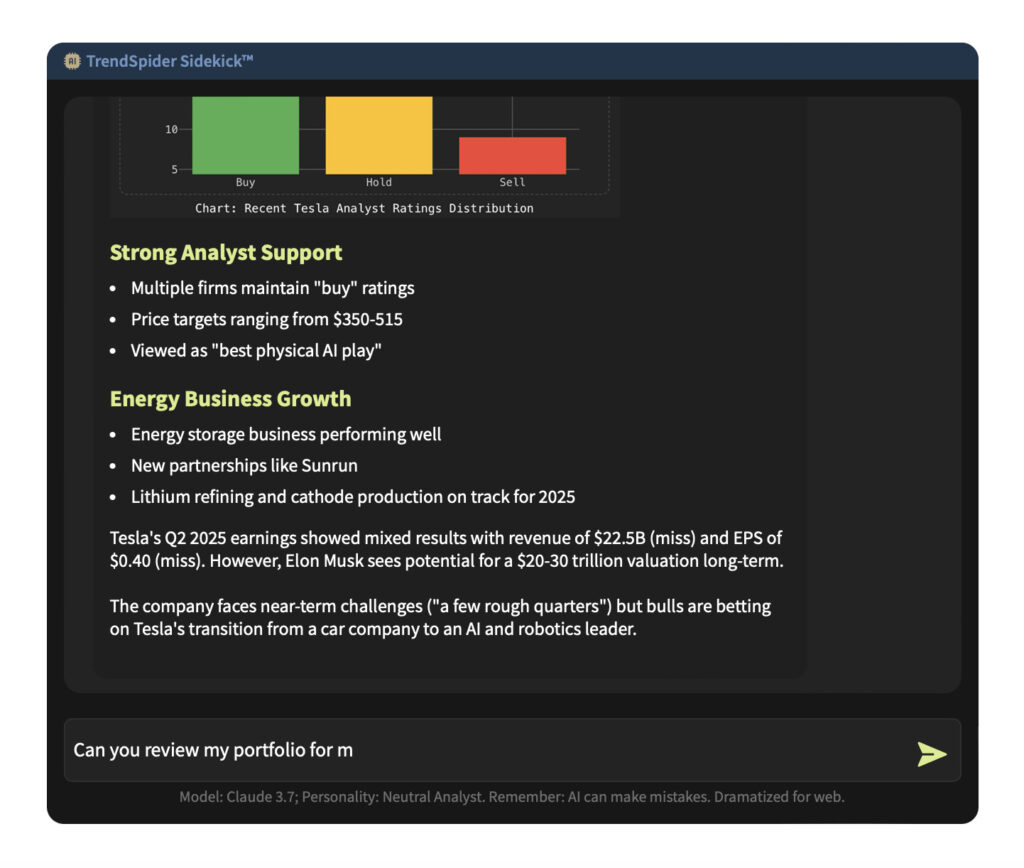
TrendSpider Sidekick is their built-in financial AI, purpose-built for active investors:
- Deeply integrated with your TrendSpider workspace: Sidekick “sees” your open charts, indicators, backtests, and notes.
- Draws on real-time market data, social sentiment, fundamentals, insider trading, earnings, and more – all from trusted TrendSpider sources to avoid hallucinations.
- Ideal for quick answers: Ask natural-language queries like:
- “Summarize today’s biggest market movers.”
- “Overlay the last 30 days of earnings headlines on my chart.”
- “Give me the bull and bear case for {TICKER}.”
Capabilities include:
- Accessing and analyzing almost any data TrendSpider holds – including candles, fundamentals, alt data, and your own custom content.
- Interpreting chart annotations, adding arrows/lines, explaining indicator meaning, and even reviewing backtest results with smart feedback.
- Generating tables, visual charts, and walking you through Strategy Bot performance – Spotting inconsistencies and advising on risk – like unbalanced returns, overfitting, or outlier-driven gains.
Choose your Sidekick Persona:
Neutral Analyst– balanced and professionalWarren– long-term investor mindsetGraham– stoic, depth-focusedSimon– data-heavy, number-focused tables and chartsKaren– brutally honest skepticWall Street Dominator– bold, Reddit-style flair
These personas change tone and analysis style while maintaining accuracy.
Sidekick is also available on Mobile too, helping you analyze on the go.
TrendSpider isn’t free for unlimited use however.
You do get 10 free Sidekick messages per calendar month (from the 1st to the end of the month), regardless of which core plan you’re on.
If you want more than the free messages or access to more advanced AI models however, there are optional Sidekick subscription tiers:
- Basic – Up to 100 messages/month, includes Claude 3.7, Claude 4, and Gemini 2.5 Pro – $49/month
- Plus – Up to 300 messages/month, adds ChatGPT-4.1 and ChatGPT-5 – $129/month
- Max – Up to 1,000 messages/month, full model access – $349/month