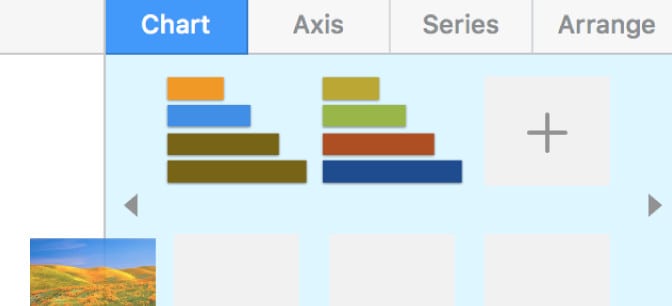
Although Pages for Mac is Apple’s word processing software for Mac users, you can create Gantt charts on a Mac in it for free.
Pages allows you to insert 2D Bar Charts into documents which you can tweak to make a simple Gantt chart.
It’s important to be aware that Apple Pages is not designed for making Gantt charts or project management of any kind.
There are no Gantt chart templates in Pages for Mac because it’s mainly designed for word processing on Mac.
Formatting and making changes to Gantt charts made in Pages is also time consuming and not very intuitive at all.
We definitely don’t recommend using Pages for creating Gantt charts if you’re planning to do presentations or generate reports from them.
To make Gantt charts professionally on macOS, we strongly recommend checking out professional project management software for Mac which do an amazing job of making Gantt charts for project management.
You May Also Like:
However, if you just want something very basic, here’s how to create a Gantt chart in Apple Pages for Mac.
- If you haven’t already got the latest version, download Pages for Mac from the Mac App Store.
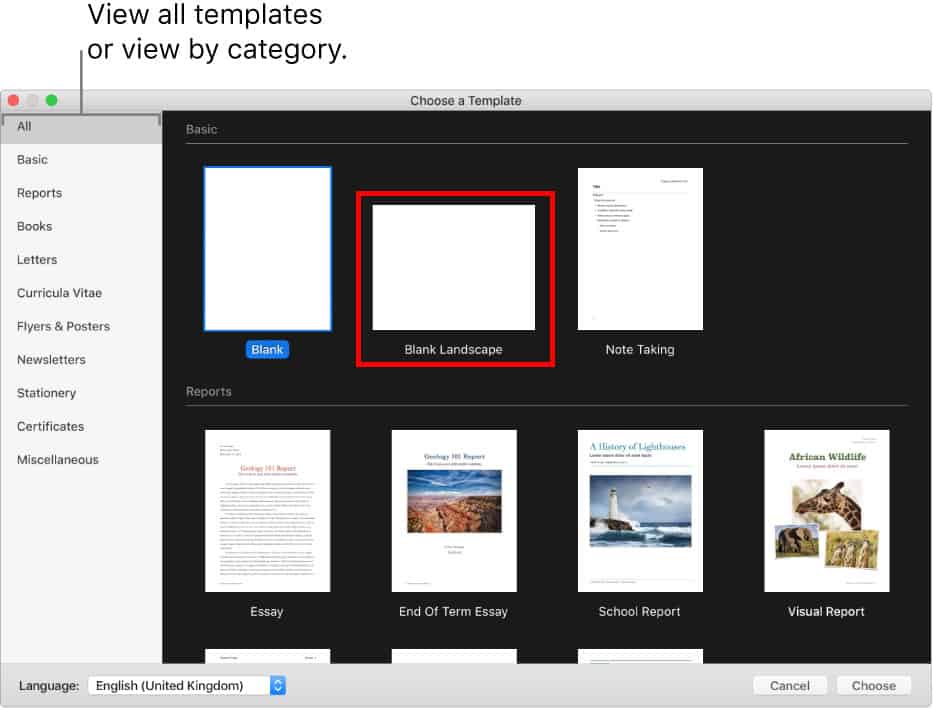
- Open a new Blank Landscape document from the templates gallery.
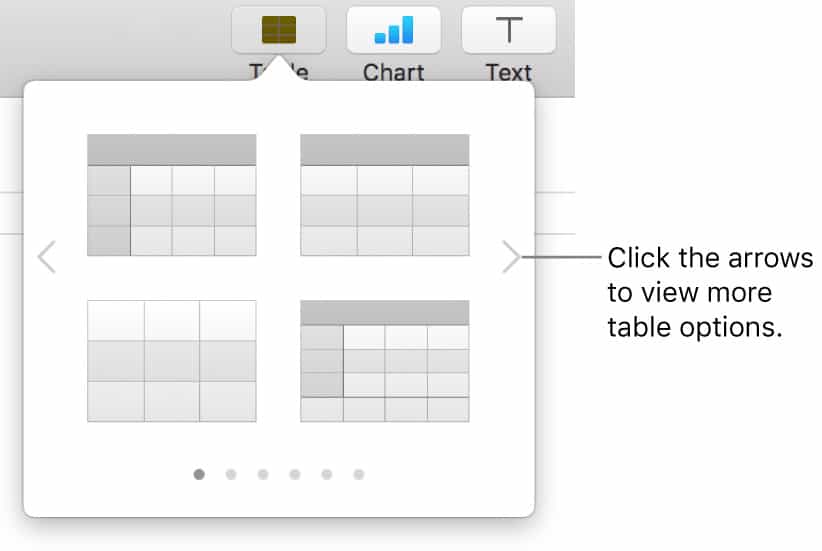
- Insert a Table into your document by going to Insert > Table or click on the Table button in the taskbar at the top of Pages.
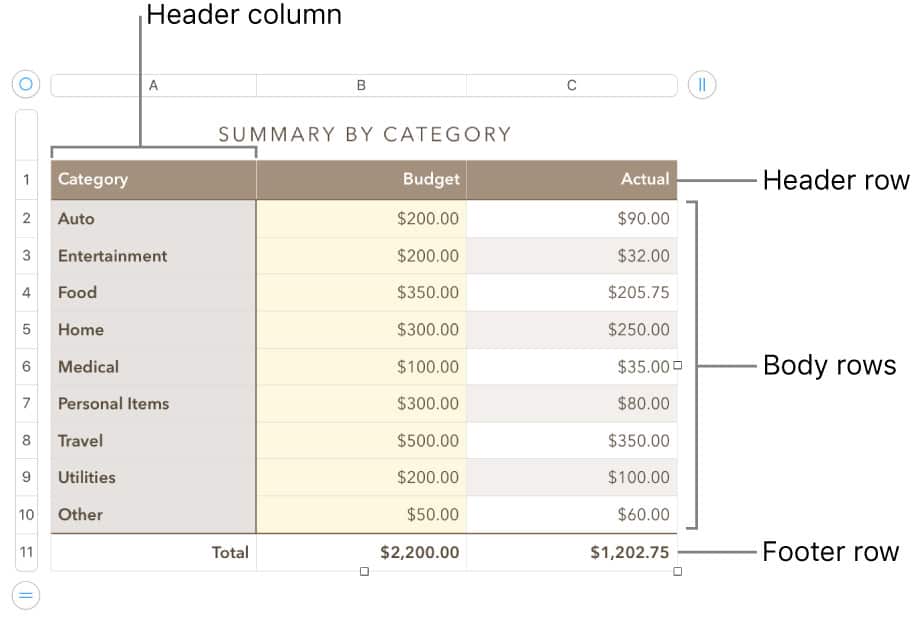
- You then need to enter the key metrics of your project in the table rows such as duration, phase and project name in the rows of the table. The example below is how you would populate a financial spreadsheet although a Gantt chart would be slightly different.
- Once you’ve done this, go to Insert > Chart and select the 2D Stacked Bar Chart which gives the horizontal look of a Gantt chart even if in reality, it’s still just a bar chart.
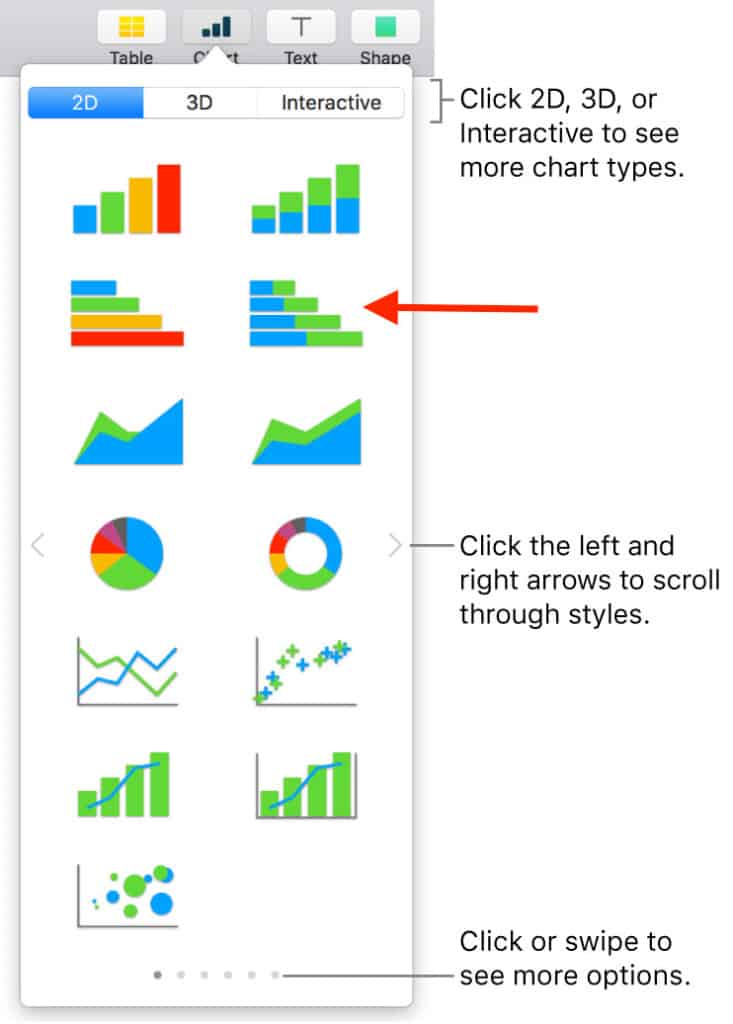
- Pages will then generate a blue and green basic stacked bar chart based on the chart data you’ve entered.
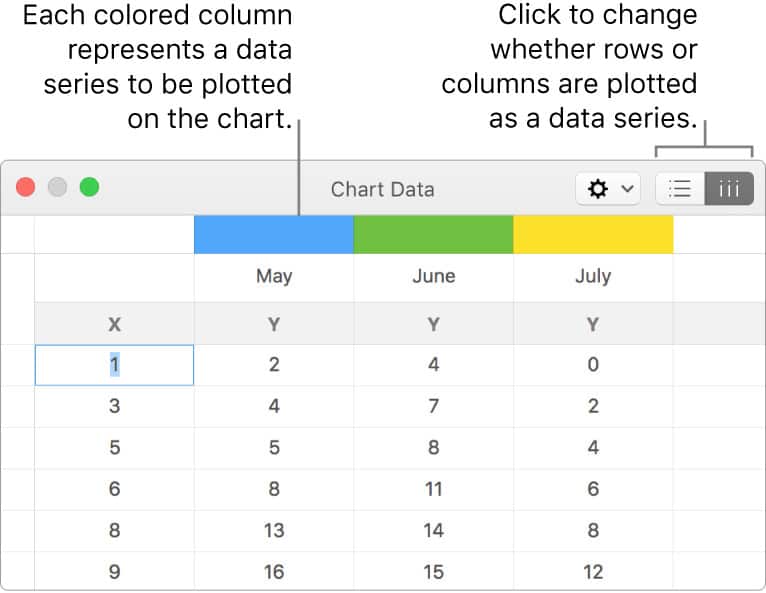
- Select Edit Chart Data and you can then copy and paste the data you created earlier into the chart fields
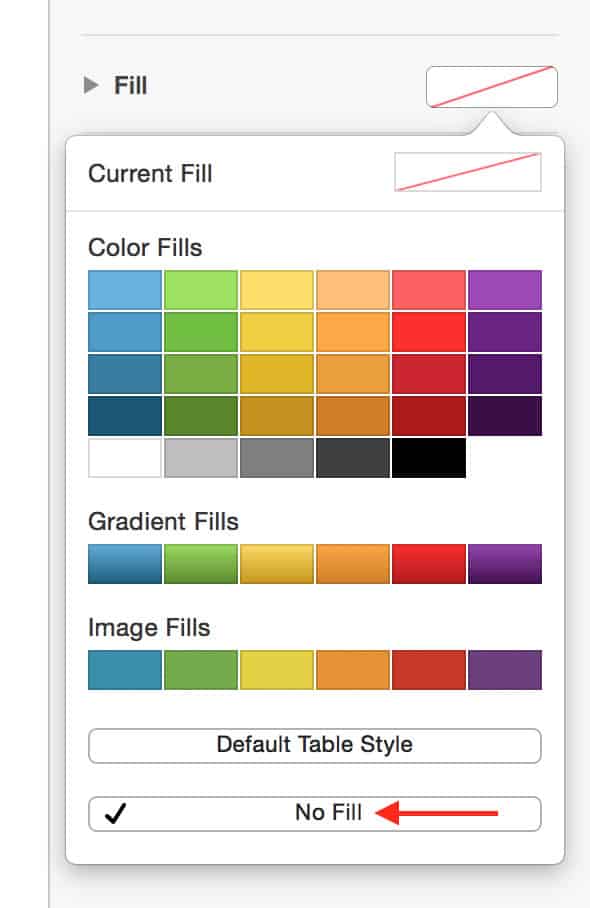
- To make it look more like a Gantt chart, double click on any of the blue bars, open the Style pallet, click on the color indicator next to Fill and select No Fill. This makes the blue bars transparent so your chart looks like a Gantt chart.
That’s about the limit of making Gantt charts in Apple Pages.
The most you can customize is the tasks in more detail using the color pallet, add strokes, shadows and other graphical enhancements.
It’s time consuming, limited and not very useful for tracking projects in real time and certainly not for tracking complex projects.
You can also make Gantt charts using Apple Numbers and although it offers slightly more than Apple Pages, it’s still not designed for project management.
Overall, you’re much better off using software designed for making Gantt charts or a proper project management solution on your Mac.
If you have any problems creating a Gantt chart on your Mac using Pages, let us know in the comments below.


