
Creating flowcharts in Microsoft Office and Microsoft 365 is something many Mac users attempt, usually because they already have access to Excel and Word. But while both tools technically support flowchart creation, neither are best suited for the task.
However, while we strongly recommend using dedicated flowchart software for Macs, Excel and Word do provide a free way to create flowcharts on a Mac.
This guide breaks down exactly when to use Excel vs Word for flowcharts, based on usability, scalability, formatting, and real-world situations.
Contents
- Quick Verdict
- Excel vs Word: Flowcharts
- 1. Canvas & Layout Flexibility
- 2. Ease of Creating Flowcharts
- 3. Formatting & Design Control
- 4. Working With Complex Flowcharts
- 5. Integration With Data
- 6. Exporting & Document Use
- 7. Stability & Usability
- 8. Limitations of Both Tools
- When To Use Excel vs Word (Real-World Scenarios)
- Excel vs Word: Final Comparison Table
- Final Verdict: Which Is Better?
- Should You Use Either?
- FAQ
- Best Alternatives to Excel & Word for Flowcharts
Quick Verdict
- Use Excel for: complex, large, data-driven, or multi-page flowcharts
- Use Word for: simple diagrams inside documents or reports
In our opinion: Excel is better for creating flowcharts but Word is better for presenting them – but here’s why.
Excel vs Word: Flowcharts
| Feature | Excel | Word |
|---|---|---|
| Canvas size | Large, flexible grid | Limited to page |
| Best for | Complex processes | Simple diagrams |
| Ease of editing | Easier bulk edits | More manual steps |
| Formatting control | Strong | Moderate |
| Document integration | Needs exporting | Native |
| Data integration | Excellent | Very limited |
Let’s look at some of these key areas in more detail.
1. Canvas & Layout Flexibility
Excel: Built for Large Flowcharts
Excel provides a virtually unlimited canvas, allowing you to:
- Scroll, zoom, and expand freely
- Build flowcharts across multiple “pages”
- Move shapes easily without breaking layout
This makes it ideal for:
- Business processes
- System workflows
- Multi-step diagrams
Excel’s flexible canvas is widely considered its biggest advantage.
Word: Restricted to Pages

Word’s flowcharts are confined to page-based layouts, which creates problems:
- Large diagrams must be split across pages
- Moving shapes between pages is awkward
- You lose visibility of the full process
This makes Word unsuitable for anything beyond simple diagrams.
✅ Winner: Excel
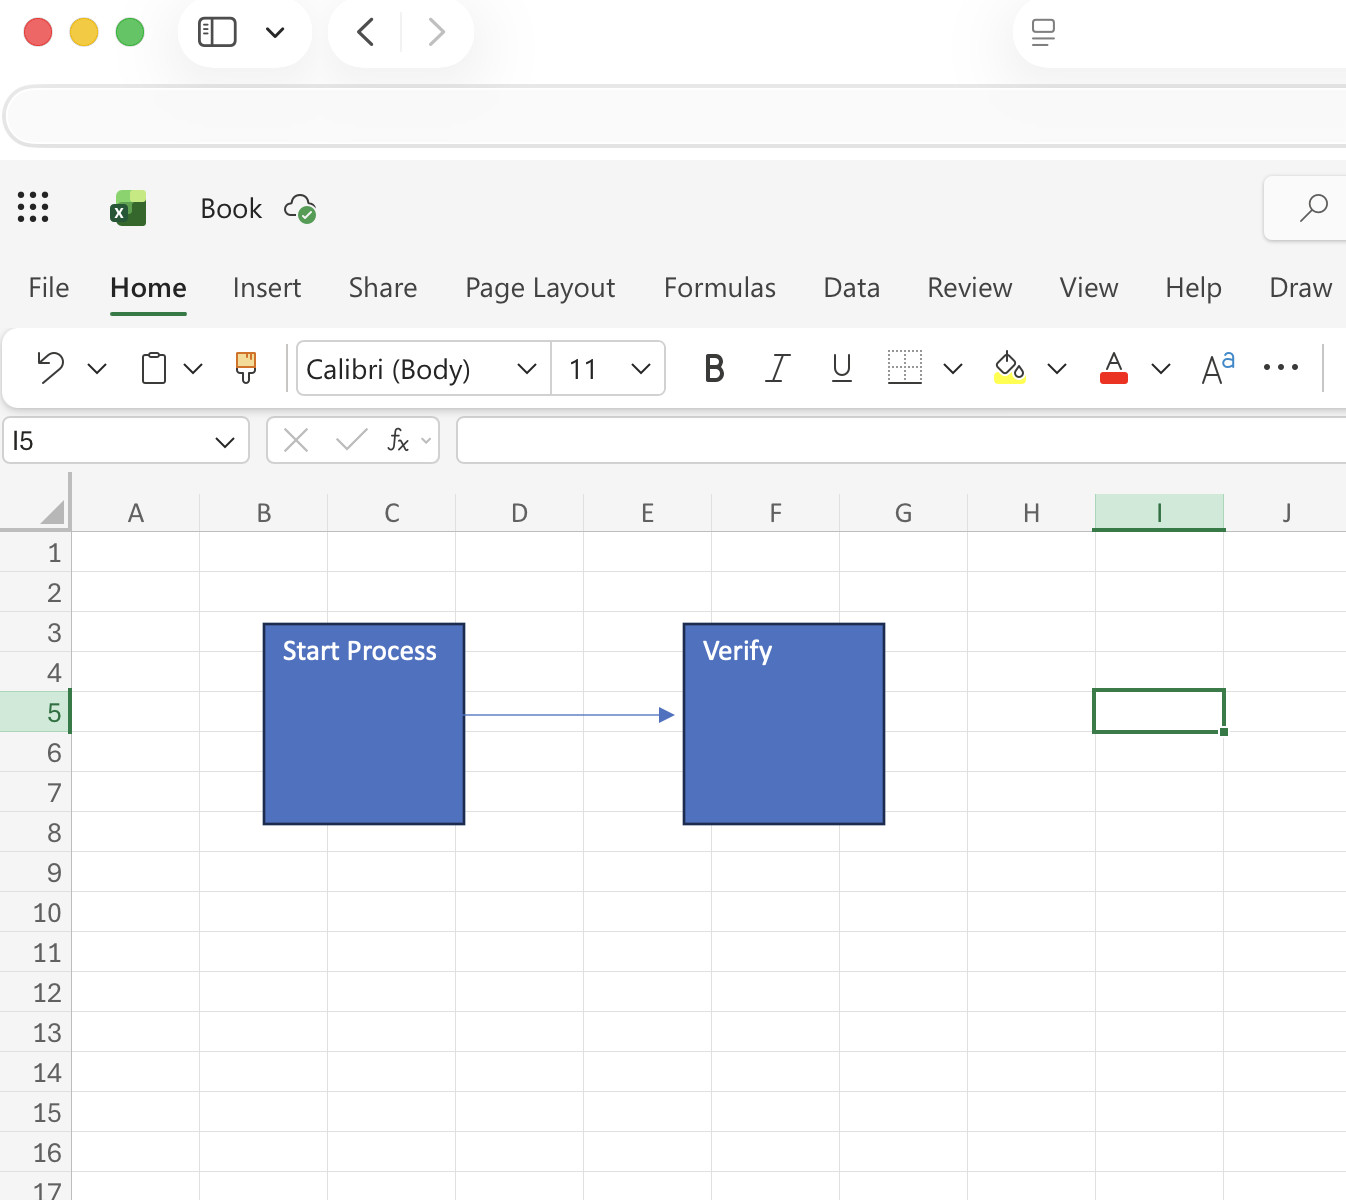
2. Ease of Creating Flowcharts

Excel: Faster Input & Editing
- Click a shape and start typing immediately
- Easily select and edit multiple shapes
- Bulk formatting (fonts, alignment, etc.) is straightforward
This significantly speeds up building complex diagrams.
Word: More Manual Steps

- Requires extra steps just to add text to shapes
- Multi-shape formatting is limited
- More clicking and repetition
This is fine for small diagrams but very frustrating at scale
✅ Winner: Excel
3. Formatting & Design Control
Excel: Better Consistency
Excel allows:
- Uniform formatting across shapes
- Easy alignment and spacing
- Centralised formatting controls
➡️ You can standardise entire diagrams quickly.
Word: More Fragmented Formatting
- Formatting options are split across menus
- Harder to apply consistent styles across multiple shapes
➡️ Requires more manual effort to maintain consistency
✅ Winner: Excel
4. Working With Complex Flowcharts
Excel: Handles Complexity Better
Excel shines when:
- Flowcharts become large or detailed
- You need structured layouts (rows/columns)
- You’re building swimlane diagrams
The Excel grid system naturally supports structured workflows.
Word: Struggles With Scale
- Becomes cluttered quickly
- Hard to manage positioning
- Layout can break easily
Word in not suitable for advanced process mapping
✅ Winner: Excel
5. Integration With Data
Excel: Major Advantage

Excel lets you:
- Link flowcharts with data tables
- Add metrics next to process steps
- Analyse workflows directly
This is Ideal for business analysis and optimisation.
Word: No Data Capability
Word is purely visual:
- No meaningful data integration
- No analysis capabilities
This only makes it better for static documentation
✅ Winner: Excel
6. Exporting & Document Use
Word: Best for Final Documents

Word wins when it comes to:
- Embedding flowcharts in reports
- Sharing documentation
- Printing and formatting pages
Flowcharts are already in the final format
Excel: Extra Step Required
- Must copy or export flowcharts into Word
- Formatting may need adjustment
- Version control can become messy
This adds a few more hoops to jump through for publishing regularly
✅ Winner: Word
7. Stability & Usability
Excel: More Predictable
- Shapes behave more consistently
- Fewer layout bugs
- Easier to manage large diagrams
Word: Known Layout Issues
- Shapes can shift unexpectedly
- Graphics handling can be inconsistent
This can make complex diagrams frustrating to maintain in our experience.
✅ Winner: Excel
8. Limitations of Both Tools
Even though Excel generally wins, neither tool is perfect.
Excel Limitations
- No dedicated flowchart engine
- Manual alignment required
- Connectors can break
- Limited automation
Excel is not ideal for professional diagramming tools
Word Limitations
- Small canvas
- Weak multi-shape editing
- Poor scalability
Word is best used for basic uses
When To Use Excel vs Word (Real-World Scenarios)
Use Excel If You:
- Need large or complex flowcharts
- Are mapping business processes
- Want to analyse workflows with data
- Need swimlane diagrams
Use Word If You:
- Need a simple flowchart in a document
- Are writing reports or proposals
- Only need basic diagrams
- Prioritise presentation over editing
Excel vs Word: Final Comparison Table
| Category | Best Tool |
|---|---|
| Large flowcharts | Excel |
| Ease of editing | Excel |
| Formatting control | Excel |
| Data integration | Excel |
| Document publishing | Word |
| Simplicity | Word |
| Stability | Excel |
Final Verdict: Which Is Better?
For most users:
Excel is the better tool for creating flowcharts. However, Word is better for embedding them into documents
The key difference comes down to intent:
- Excel = Creation & analysis
- Word = Presentation & documentation
Should You Use Either?
If you create flowcharts regularly, neither Excel nor Word is ideal.
Many Windows users use Visio for flowcharts (although Visio isn’t available for Macs). There are however plenty of excellent dedicated flowchart software and alternatives to Visio for Mac which offer:
- Automatic layout
- Smart connectors
- Collaboration
- Templates
But if you’re sticking with Microsoft Office, Excel is your best option by a clear margin.
FAQ
Is Excel or Word easier for flowcharts?
Excel is easier for anything beyond very simple diagrams because it allows faster editing and better layout control.
Why do people still use Word for flowcharts?
Because it integrates directly into documents, making it convenient for reports and presentations.
Can you create professional flowcharts in Excel?
You can, but it requires manual effort and lacks advanced diagramming features.
Is Word good for complex flowcharts?
No – Word struggles with large diagrams due to page limits and layout issues.
Best Alternatives to Excel & Word for Flowcharts
If you regularly create flowcharts, both Excel and Word quickly become limiting. They lack automation, smart connectors, and collaboration tools features that dedicated diagramming apps handle effortlessly.
For some options, check out our guide to the best flowchart and diagram software for Mac.